 Whether it is for a land survey searching for minerals on Earth, or for a space exploration in search of alien life forms, the analysis of any signal boils down to looking at its time and frequency information. While an oscilloscope displays a signal with respect to time, a spectrum analyzer shows it with respect to frequency. Both of these tools are very important in any signal analysis application. This article explains the difference between oscilloscope and spectrum analyzer using examples.
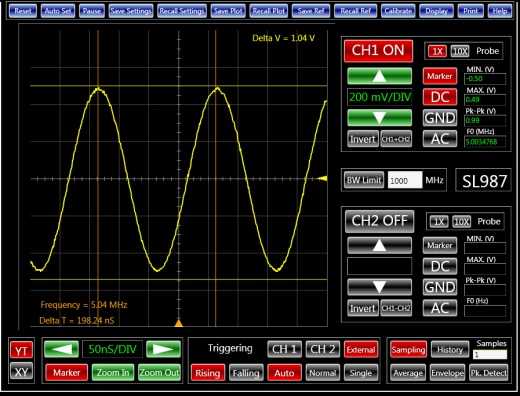 Fig.1: 5 MHz sine wave on an oscilloscope.Oscilloscopes are often used to get detailed timing information of a signal, or the timing relationships between several signals. We might use an oscilloscope to find the relative time delay between two signals. On the other hand, to observe the frequency properties of a signal, a spectrum analyzer is required. For example, we might utilize a spectrum analyzer to consider the harmonics of a signal. In this article, we study both the time domain and frequency domain using an oscilloscope equipped with a companion spectrum analyzer and a built-in arbitrary waveform generator.
Time Domain vs. Frequency Domain
First, we set the generator to output a 5 MHz 1 VPP or .707 VRMS sine wave 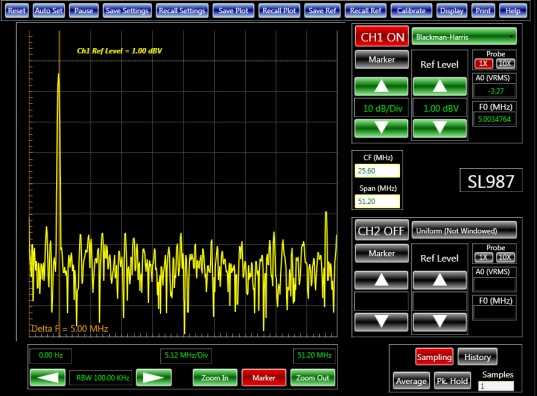 Fig.2: 5 MHz sine wave on a spectrum analyzer.signal. CH1 shows this signal as shown in figure 1. Besides its basic shape and amplitude, there is not much else that can be learned about the signal using just the oscilloscope. Let's now consider the spectrum analyzer. As an ideal sine wave has only one frequency component, we should expect to see an impulse at 5 MHz corresponding to the .707 VRMS of the input signal, with all other frequency components at zero. Any other impulses are due to impurity of the sine wave. Figure 2 shows the spectrum analyzer and the oscilloscope plots for this signal.
The true Nature of a Signal
In real life, however, the nature of signals is not known in advance. Suppose the signal instead is an FM signal from a radio station with a 5 MHz carrier frequency being modulated by a 10 KHz sine wave. At first glance, the oscilloscope,figure 3, and the spectrum analyzer would both show a similar output as before. However, using the spectrum analyzer, we can take a closer look by zooming in on the signal peak at 5 MHz, allowing us to discover the true nature of the signal, as shown in figure 4. The effect of the modulation on the 5 MHz carrier signal is the addition of the peaks at both sides of the fundamental peak at 10 KHz intervals. This discovery is made easily using a spectrum analyzer, but it is practically impossible to observe this from the time domain plot of the oscilloscope.
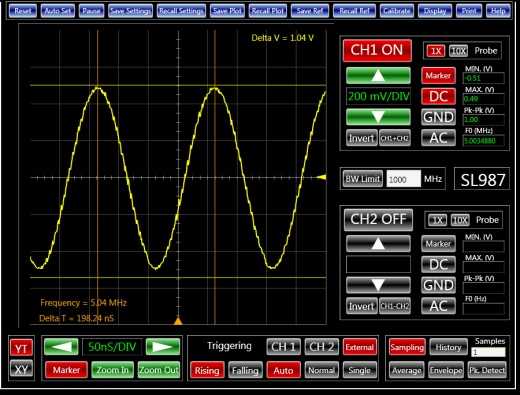 Fig.3: FM signal on an oscilloscope. Fig.3: FM signal on an oscilloscope. |
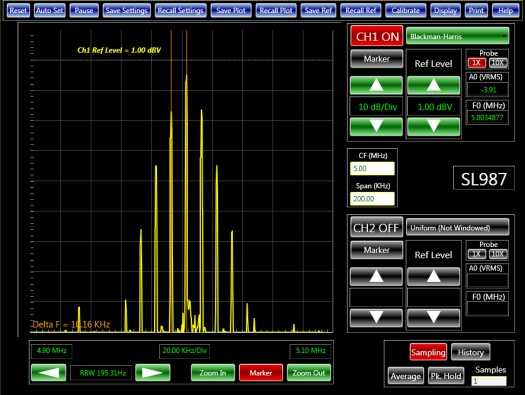 Fig. 4: FM signal on a spectrum analyzer. Fig. 4: FM signal on a spectrum analyzer. |
Characterizing Filters
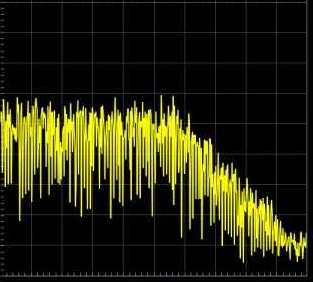
To further illustrate the differences between the instruments, consider a low pass filter with a cut-off frequency of 300 KHz. To find the settling time or the time response of this filter, we apply a square wave to its input and look at its output. Figure 5 shows the timing behavior of the filter with a settling time of about 16 uS. However, this only gives us 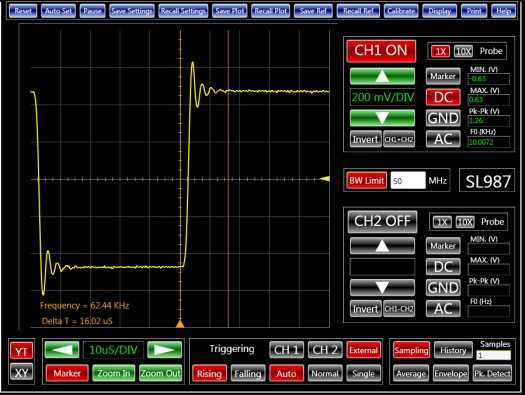 Fig.5: Evaluating a filter using an oscilloscope.
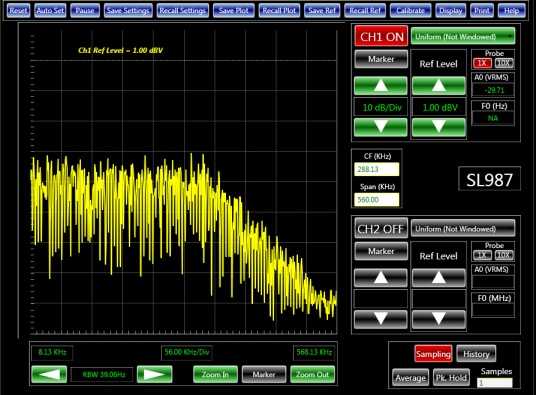 Fig.6: Evaluating a filter using a spectrum analyzer.a single data point regarding the performance of the filter. To fully characterize the filter across different frequencies, we can change the input of the filter to a white noise signal (i.e., inputting all frequencies) and look at it its frequency response as shown in figure 6. Using the spectrum analyzer, we can verify that the filter is indeed a decent 300 KHz low pass filter.
Both in one Instrument
Oscilloscopes and spectrum analyzers are two of the most important instruments in any electronic laboratory. They serve many purposes in signal analysis in a wide range of applications such as audio, video, communications, radar, and many other designs. Traditionally, the price of spectrum analyzers has been a prohibitive factor for some users. With the introduction of new affordable oscilloscopes with built-in spectrum analyzer capability, this cost has been coming down to affordable levels, even for amateurs and hobbyists.
Author: Arash Ushani, Senior Application Engineer, Analog Arts
More about spectrum analysis with oscilloscopes
Analysis of complex radar signals
Analyze EMI problems with an oscilloscope